In a comment to my second “Chocolate Rivers” post, commenter “homeboy” asked a number of good questions. Can’t learn if you don’t ask. However, instead of leaving the questions as an exercise for the student, I figured I’d go ahead and see if I could satisfy him.
1. With improvements in medical technology and access (cell phones), are comparisons with past homicide numbers meaningful?
Well, I guess we’d need to look at homicide rates and try to compare to wounding data. The wounding data is kind of hard to come by. Or, perhaps, homicide to attempted homicide, though that normally doesn’t break out by weapon. First, as far as homicide rates are concerned, there’s this chart for rates from 1900 through 2000:
that shows the rate varying widely. In 1993 the rate was 10.1 per hundred thousand population. In 2000 the rate was 6.1. In 2004 it was 5.5. Prior to 1910? Perhaps the data-gathering wasn’t up to the standards of today?
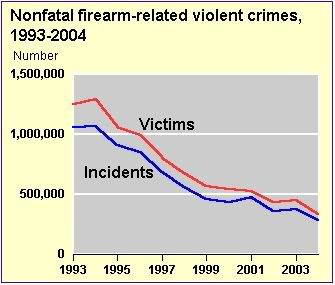
However, there’s this fascinating graph:
that shows that non-fatal firearm related crime has also been on a steep decline since 1993 – even though, according to that Clinton-era Whitehouse press release, almost two million new handguns enter circulation each year. And remember, a lot of those new guns are what the Violence Policy Center and its ilk term “Pocket Rockets” – more powerful, higher capacity handguns:
Pocket rockets are a prime example of how the firearms industry has exploited increased lethality—greater killing power—over the last several decades to boost sales in its saturated markets.
But note something – the VPC states in that year 2000 report:
The industry has heavily promoted pocket rockets in connection with a wave of new or revised state laws that permit licensed persons to carry concealed firearms.
When did these “new or revised state laws” start? In 1987 with the passage of Florida’s “shall issue” law. In 1990 there were only 15 “shall-issue” states. In 1995 there were 27. In 2000 there were 30. After 1993, what does the homicide rate do? It declines. From 10.0 in 1990, to 8.7 in 1995 to 6.1 in 2000, to 5.5 in 2004, all while literally millions of these guns with supposedly “increased lethality – greater killing power” have entered the market. If the hypothesis is that “improvements in medical technology” are responsible for a decrease in homicide rates – the implication being that more people are getting shot, but surviving the experience – then that theory is shot to hell (pun intended) by this data.
Fewer people are getting shot. Fewer people are getting shot at. And there are more guns in private hands each and every year.
You’ll note that the chart in the VPC report:
ends in 1997. I guess they didn’t want to include data for 1998 and 1999, since it contradicted their premise, and the data since then continues to do so.
2. It seems more honest to compare attempted murder rates since the survival rate is much higher now; is there statistical data available, or can it be estimated?
Well, perhaps the survival rate is “much higher now,” but compared to when? The survival rate in 1950, or the survival rate in 1993? Or is the “increased lethality” of modern guns offsetting the advances in medical technology? I don’t know, but it appears that, at least since the mid-90’s, the actual incidences of gun violence have been declining – even though there are more and more guns in circulation, and – if you want to believe the VPC – those guns have “greater killing power.”
The fact of the matter is, violent crime is down – tremendously. Look at this chart:
From a peak in 1993 of 12.0 aggravated assaults per 100,000 population declined to 4.3 in 2004.
More guns have not meant more violent, more deadly crime. But that doesn’t stop the gun-grabbers from preaching the gospel of “more guns = more gun violence” every chance they get.
3. Is the data available to remove the suicide and domestic violence effects from the statistics used to claim that handguns in a home lead to higher homicide rates, and if so, what is the result?
Not that I’ve seen. Not that the National Academies of Science has seen either, according to their recent report. That data just doesn’t exist. Just for the record, I don’t believe that “handguns in the home” do lead to higher homicide rates.
4. Since we incarcerate at much higher rates than even 20 years ago, what effect is this having on who is committing the bulk of homicides?
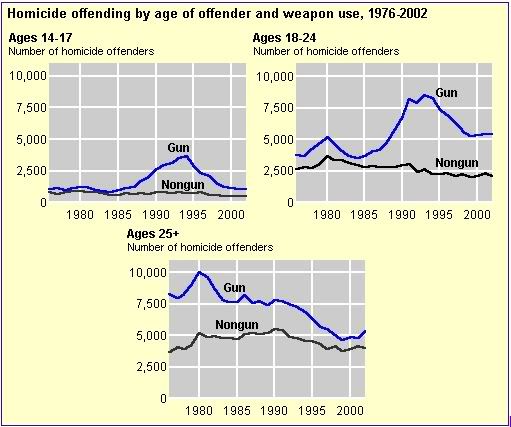
Apparently not much. According to this graph:
the decrease in homicide rates has been primarily a decrease in homicide by handgun, and according to this graph,
the spike in homicides was primarily committed by young men in the 18-24 age range. And their victims? The same age group:
This suggests to me at least that part of the reason that homicide rates have declined is that the criminally-inclined youth have done a bang-up job (so to speak) of killing themselves off. It’s not a matter of incarcerating them, it’s a matter of burying them.
5. If we’re incarcerating so many people, but we’re still having a problem with homicide, what is it we’re not doing right? Is there a high recindivism rate, or are new criminals arising to fill the some niche, or are we just incarcerating the wrong people?
Well, that’s if you consider a homicide rate of 5.5 per hundred-thousand “a problem.” We’re a violent society. The rate we have now is pretty damned low, historically. It’s down tremendously from a decade ago, but you couldn’t tell that by the rhetoric coming out of the gun-grabber, er, gun-control, um, gun-safety groups today. Certainly everyone would like to see it lower, but at what other cost to society? As you noted, we’ve already got a helluva lot of people in prison.
6. If it’s a high recidivism rate, is it because prison time insufficient deterent, or is the percentage of perpetrators actually punished too low to matter?
Could it be that prison (other than keeping violent criminals separated from the population) doesn’t actually deter? I don’t know.
7. How much of the homicide rate is caused by the “war on drugs” making narco-trafficing so lucrative?
Well, it would appear that the majority of homicides are related to drugs. Look at this graph:
This graph trends up, and mostly for “gang related” – read “inner-city drug wars.”
UPDATE, 1/27: Reader Earl Harding notes in a comment that the graph above is not saying what I’m attributing to it. He’s quite correct. My error. However, a little additional research and I found this:
In an analysis of New York City’s homicides in 1988, Paul Goldstein and his colleagues concluded that 74 percent of drug-related homicides were related to the black market drug trade and not drug use. For instance, the leading crack-related homicide cause was shown to be territorial disputes between rival dealers, and not crack-induced violence or violence (predatory thieving) to obtain money for crack purchases.
Small data point, but I think one that could be easily extrapolated. A Columbia University report stated:
In New York City, drug-related violence contributed to sharp increase in homicides beginning in 1985, peaking at a record rate in 1991. Estimates from police and injury surveillance systems suggest that over half the homicides in these years were drug related, often associated with drug market transactions. These record homicide rates led to intensive street-level law enforcement efforts beginning in 1987, resulting in unprecedented rates of drug arrests and sharp increases in the state prison population.
Still, that’s only New York.
The normally reliable GunCite reports:
- Indianapolis/Marion County – Homicide review conducted from 1997 thru mid-1998. Victims and suspects were chronic offenders.
Among homicide suspects:
- 75% had either an adult or juvenile criminal record.
- An average of 3.7 adult arrests.
- Those with a prior record averaged 6 adult arrests and 5.5 juvenile arrests.
Among homicide victims:
- 63% had adult or juvenile criminal records.
- An average of 4.6 adult arrests.
- Those with a prior record averaged 8 adult arrests and 4.5 juvenile arrests.
- For the 206 suspects and victims:
- 1600 total arrests
- 500 arrests for violent crimes
- 800 convictions
- 53% of homicide incidents were drug-related.
- Minneapolis – Data was analyzed from January 1994 through May 1997. Nearly 45 percent of all homicides appeared to be gang related. More than 40 percent of gang members who were homicide victims or suspects had been on probation and 76.8 percent had arrest histories prior to the homicide incidents, with an average of 9.5 arrests. Suspects and arrestees had 7.4 prior arrests and victims had 7.5 prior arrests.
Draw your own conclusions.
End of Update.
8. What are the demographics of homicide victims and perpetrators; do we have an urban, suburban or rural problem; do we have a poverty problem; or is it a wide spread social problem; or is it predominately racial/predjudical problem; or is it largely caused by the drug war?
And here’s the question the gun-grabber organizations stay as far away from as they can possibly manage: who’s killing, and who’s dying? Look at these graphs, and pay particular attention to the scales:
It’s young, black, urban males. They make up the overwhelming majority of the victims and the perpetrators.
As I detailed in a post from 2003:
I have found the Centers for Disease Control WISQARS Fatal Injury Report tool quite helpful, so I’ll use it again. The latest data is for 2000, so let’s see what it says.
Total homicides: 16,765.
Total population: 275,264,999.
National homicide rate: 6.09/100,000 (Higher than the FBI’s 5.50)
Black homicide victims: 7,867 – Proportion: 46.9%, in agreement with FBI data.
Rate per 100,000: 22.28 – Considerably lower than the FBI says.
Other homicide victims: 8,898 – Proportion: 53.1%
Rate per 100,000: 3.7 – Again, considerably lower than the FBI says, but the ratio of 6:1 does agree with FBI numbers.
Now, if the U.S. had an overall homicide rate of 3.7/100,000 the total number of homicides in 2000 would have been 10,185. The total number of homicides for the black demographic: 1,306. A reduction of 6,561.
Another nice feature of the WISQUARS tool:
Number of firearm related homicides, all ages, all races, both sexes: 10,801
(36% of the total homicides – 5,964 people, were killed without a firearm, for a non-firearm homicide rate of 2.17/100,000.)
Number of black victims of homicide by firearm: 5,699 (53% of all homicide victims by firearm)
Number of black male victims between 15 and 35 years of age: 4,528 (79% of the total black victims of homicide by firearm, 42% of all victims)
Number of all other male victims between 15 and 35 years of age: 3,274 (30% of all homicide victims by firearm)
Number of black male victims between 15 and 35 that died by firearm: 4,343 (84% of the black male victims, 40% of the gunshot homicides.)
Number of all other male victims between 15 and 35 that died by firearm: 2,402 (73% of the white male victims – close enough to parity.)
And note, 62% of all gunshot homicide victims are males between 15 and 35 years of age.
The homicide by firearm rate for males between 15 and 35? Seventeen per hundred-thousand population.
So, does this prove anything? No. But it suggests, and pretty strongly. It suggests that the homicide by firearm problem is concentrated in a small, identifiable group. It suggests that homicide is heavily concentrated in the overall black demographic, and especially in young black men. And it suggests that instead of pursuing wholesale gun control laws that affect everybody, we ought to be pursuing policies that directly address that problem, because “gun control” doesn’t. And it isn’t a case of whites killing blacks, either. The fact is, it’s blacks killing other blacks in disproportionate numbers, and it’s largely restricted to urban (read “gang-related”) violence. See these Bureau of Justice Statistic charts showing the trends in homicide by race of offender and victim. Read this LA Times article to get some kind of feeling for the problem, or this USA Today piece. Money quote, from the second piece:
“Between 1976 and 1999, 94% of black murder victims were killed by other African-Americans. Nearly two-thirds of black homicides were drug related.”
Homicide is an epidemic in the young black male demographic. If it were a communicable disease, we’d be wearing ribbons and spending money on drug research. Instead we’re banning “assault weapons” and trying to pass licensing and registration laws that this very demographic is going to ignore. (See: England, gun bans, “Yardies”, etc.) And the public health organizations and independent groups are trying to treat firearms as if they were the disease vector.
(Hopefully, all those links still work.)
What I’ve never understood is that we know that the majority of homicide is concentrated in a very small, easily identifiable population, why are we trying to attack it by regulating guns? Instead, I’ve come to the conclusion that “gun control” isn’t about reducing crime. It’s about disarming the law-abiding populace.
I hope that helped answer your questions. Now, go and do some research for yourself.
(All graphs with the exception of the VPC one are from the Bureau of Justice Statistics web page.)
UPDATE: This post generated some commentary. A related post, with links, is here: Culture


 I might as well label this as “Part II” of And There Will Be Chocolate Rivers and Fluffy Bunnies. I should subtitle it But Nobody Wants to Take Your Guns Away! too.